The version of record for (Norris 2023) posted today, and is of course open-access. Laypersons will find its Abstract, Introduction and Discussion sections quite readable, I think. But I did use some multivariable calculus to prosecute the main argument of the paper, so would like to offer a more broadly accessible summary here.
To this end, let’s unpack some text from the Draft Guidance (2023) that my paper responds to:
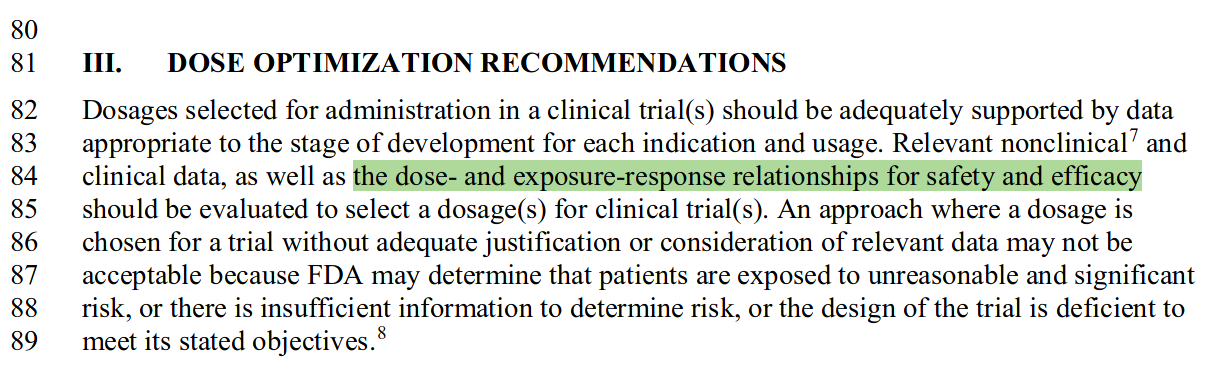
The language here may sound demure, but the footnote ‘8’ references §312.42(b) of the Code of Federal Regulations, titled “Grounds for imposition of a clinical hold” — a reminder that FDA are not to be trifled with. Thus we see FDA Oncology Center of Excellence (OCE) here impressing upon us their seriousness about “consideration of relevant data” on “dose–response relationships for safety and efficacy.”1
Considering efficacy and toxicity side-by-side
Figure 1 in my paper depicts “dose–response relationships” of both types discussed here: dose–efficacy and dose–toxicity functions:

For the sake of concreteness, in the paper I suppose that the dose–efficacy relation gives the probability \(P_r\,\) of some hoped-for therapeutic outcome (the subscript r stands for ‘remission’) as a function of the dose \(D\). The downward-bending curve in this figure shows how you would expect the efficacy of a drug to be realized: at zero dose, you get zero efficacy; from there, efficacy increases with increasing dose, but is subject to some upper limit \(\text{P}_\text{max}\) that you can never exceed no matter how high you push the dose.
The key contribution Project Optimus has tried to make, is to raise our consciousness about the toxicity of cancer treatments, encouraging us to give it due consideration alongside efficacy. In keeping with this principle, I have plotted the dose–toxicity function \(T(D)\) in tandem with \(P_r(D)\) on this very same plot. The upward-bending shape of \(T(D)\) captures the idea that the toxicity of any reasonable drug ought to be negligible at small doses, while acknowledging that toxicity may become truly severe at high doses.
Something subtle to note here is that, by plotting \(P_r\,\) and \(T\) against a shared vertical axis, this figure implicitly supposes that toxicity is commensurable with efficacy. In concrete terms, this would mean that a person taking a cancer drug could say about the experienced toxicity, “These side effects are bad enough that I would willingly trade away 10% probability of achieving a remission, to get rid of them.” In this case, the person is giving an evaluation \(T(D) = 0.1\) of the toxicities they experience at their current dose \(D\).
The technical term used for this kind of subjective valuation is utility. We would say that \(P_r\,\) measures the utility of drug efficacy, while \(T\) measures the disutility of toxicity. The net utility \(U(D) \equiv P_r(D) - T(D)\) expresses how much overall benefit the person feels they are getting from dose \(D\). This difference is depicted in the figure as the vertical gap between the curves. For an individual whose evaluation of the benefits and harms of the drug is represented by such a figure, the optimal dose \(\hat{D}\,\) finds the spot where this gap is biggest. For different individuals, the \(P_r\,\) and \(T\) curves will have have different shapes, both because the drug may objectively help or harm different patients differently, and because different people will have different subjective feelings about the balance between toxicities and benefits. (In the paper, I allow for inter-individual differences in both the \(D^*\) and \(\text{ED}_{50}\) parameters; but this is where the multivariable calculus comes into play, so I won’t digress into those details here.)
Considering efficacy versus toxicity
Figure 2 in the paper at once simplifies and generalizes the above figure. Instead of plotting two curves side-by-side, we can plot a single curve of \(P_r\,\) versus \(T\):2

On this plot, \(T\) has stolen the horizontal axis from \(D\), but we can still mark off the doses along the curve itself. (These dose markings won’t be evenly spaced, but that doesn’t cause any problems for our argument. What matters for our argument is having linear scales on the \(P_r\,\) and \(T\) axes.)
In addition to changing the axes, this plot introduces a second, subtler shift in perspective: the bars over the axis labels \(\bar{P_r}\,\) and \(\bar{T}\) indicate population-averages, which FDA in theory must consider when “advocating a dose for a population.”3 Adding those bars converts this plot from an individual patient’s perspective to the perspective of an FDA regulator. In practice, FDA might not actually compute the \(\bar{P_r}\,\) and \(\bar{T}\) on this plot as population averages, but instead may substitute fuzzier, more subjective forms of judgment. Nevertheless, a plot such as this implicitly underlies any rational FDA dose-optimization decision-making. So it seems fair to ask FDA to engage in enough introspection about its own implicit utilities at least to sketch such a curve freehand, and then enough transparency to share the sketch with us.
Now it is a nice geometrical fact that the optimal dose \(\tilde{D}\) on such a plot is found at the point of tangency of a \(45^\circ\,\) line.4 Thus even on FDA’s freehand sketch, the optimal dose may be found with high school geometry instruments. Moreover, we can also find a twice-as-toxic dose \(D_2\) to compare against \(\tilde{D}\), in what ought to be a slam-dunk trial showing that “Less is More” (Shah et al. 2021).
How big does that trial have to be?
Dr. Richard Pazdur himself identifies “the major issue” in dose optimization as:
[W]hen you reduce a dose, will it have the same efficacy? … that’s the major issue here.
Now in that ‘Conversations on Cancer’ video, Dr. Pazdur is of course speaking conversationally, and informally. But his black-or-white language “will it have the same efficacy?” is easy enough to translate into more quantitative and precise questions:
- How much efficacy is lost when reducing a dose?
- How much toxicity is averted?
- How do we judge the trade-off?
In the context of the simple ‘slam-dunk’ trial I set up above, this means we should collect enough data to estimate the lost efficacy \(p_2 - p_1\) with some reasonable precision. My paper proposes a pretty lenient standard for what is ‘reasonable’: that the ‘\(\pm\)’ on our estimate should be no bigger than half the actual value of \(p_2 - p_1\). (This is like saying that if you weigh yourself daily and want to be able to see a weight change of 1 lb, then your scale shouldn’t have an error of more than \(\pm 0.5\) lb.)
Under these conditions, the formula for the minimum trial size \(n_\text{min}\) turns out to be pretty simple:
\[ n_\text{min} = 8 \frac{p_1(1-p_1) + p_2(1-p_2)}{(p_2-p_1)^2}. \]
Minimum enrollment for a dose-optimization trial
I hope you will find it interesting to experiment with the parameters in the app below,5 to appreciate typical minimum trial sizes.
Why do trial sizes matter?
The larger the trials FDA requires for drug testing, the slower drug development will proceed, and the higher will be its costs. OCE seems acutely aware of the risk that recommending “randomized, parallel dose–response trials” may impose such burdens on drug development. Here is another passage from their new Draft Guidance (2023):
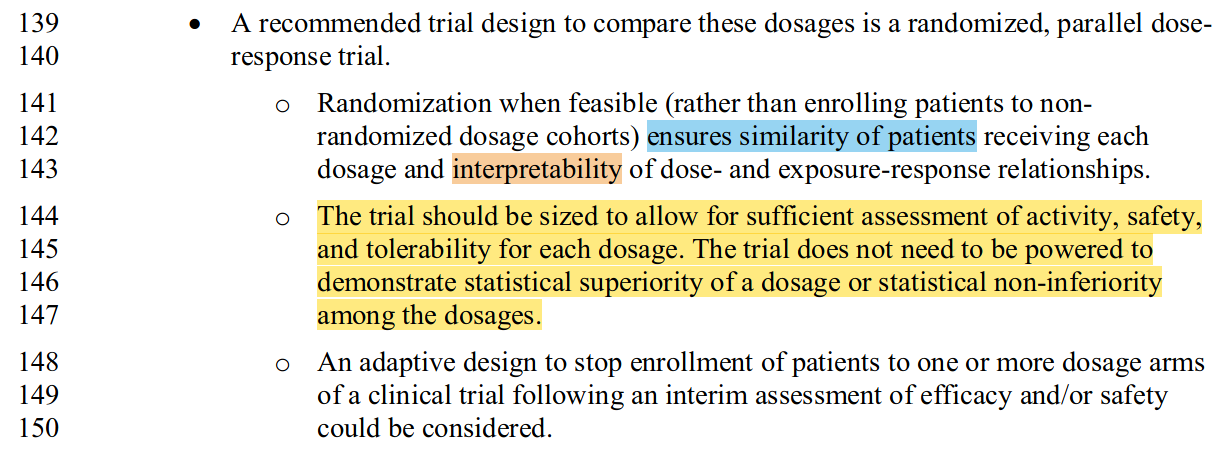
In the yellow-highlighted paragraph (I’ll examine the blue and orange highlights in a separate post), notice how OCE tries to have it both ways. These trials need to be big enough to meet the fuzzy aims of “sufficient assessment”, but not necessarily big enough to meet any objective standard that might be established by disciplined statistical thinking. What you see in my paper is precisely such reckoning—the collision with an objective standard which OCE has for too long deferred.
References
Norris, David C. 2023. “How Large Must a Dose‐optimization Trial Be?” CPT Pharmacom & Syst Pharma, September, psp4.13041. https://doi.org/10.1002/psp4.13041.
Shah, Mirat, Atiqur Rahman, Marc R. Theoret, and Richard Pazdur. 2021. “The Drug-Dosing Conundrum in Oncology — When Less Is More.” N Engl J Med 385 (16): 1445–47. https://doi.org/10.1056/NEJMp2109826.
Footnotes
I’m glossing over the distinction between dose and exposure here, and will discuss only the dose-dependence of the response to drugs. Note that the term response applies generically to both good (therapeutic) and bad (toxic) results of treatment.↩︎
In a way, the \(T(D)\) curve is still present invisibly, having been transformed to a \(45^\circ\,\) line through the origin. But since it contains no special information, it can be omitted from the plot.↩︎
This quote is from Dr. Richard Pazdur, at 1:08:07 in the linked video; but to provide full context the link takes you to Anne Loeser’s remarks beginning at 1:05:32.↩︎
To see why, start from at the origin \((D=0)\) and slowly increase your dose, traveling along the curve toward \(\tilde{D}\). Because the slope of the curve is greater than 1 throughout this stretch, your (vertical) gains in efficacy will exceed your (horizontal) increases in toxicity. So every little bump in the dose up until you hit \(\tilde{D}\) gives a net improvement. But as you pass \(\tilde{D}\) the slope becomes less than 1, and toxicity will start worsening faster than efficacy improves.↩︎
The \(\text{P}_\text{max}\) parameter sets the maximum efficacy of the drug; \(\eta\) sets how upwardly-curved the \(T(D)\) curve is; the third parameter controls the inter-individual variability (IIV) of individually optimal dosing; and the final parameter \(\tau\) determines the general ‘tolerability level’ of the drug.↩︎